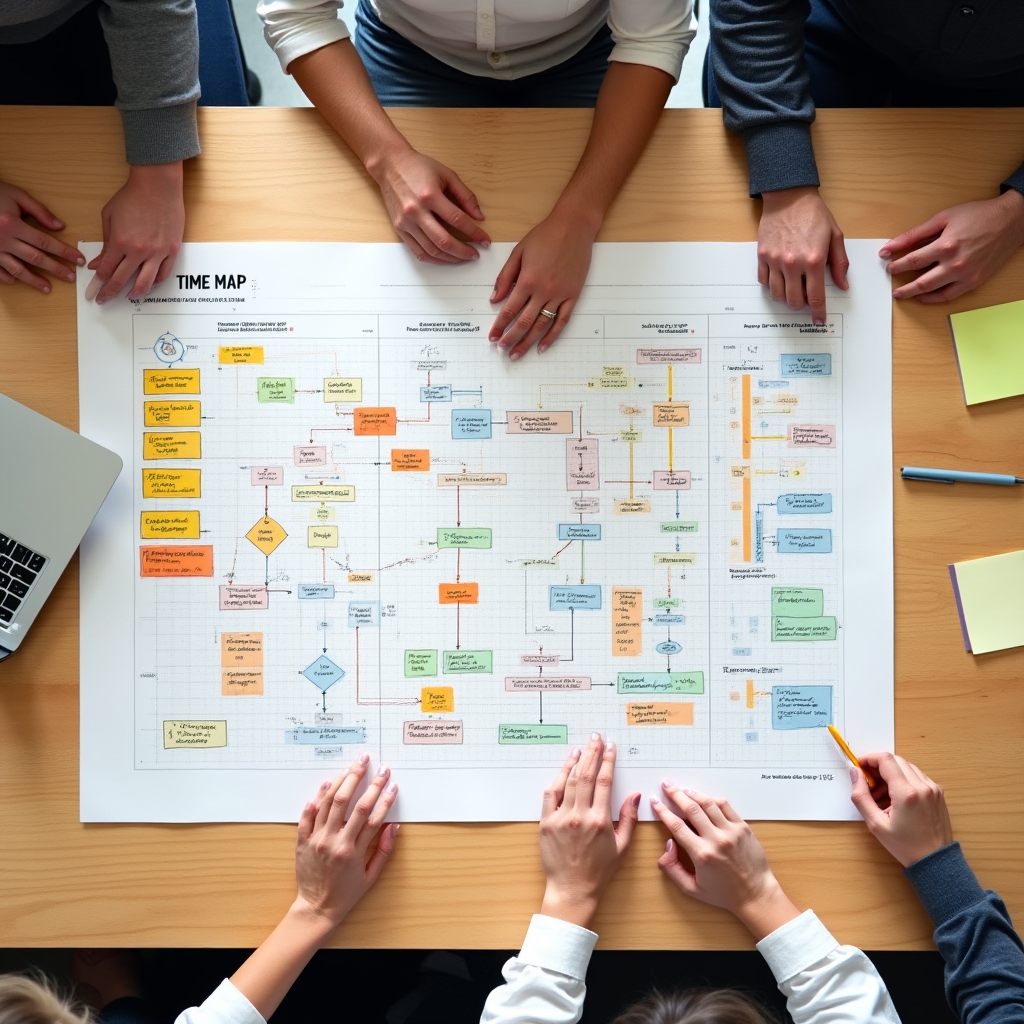
The Time Map is the core deliverable of every Finvando engagement. It's not a standard consulting report. It's a specific, visual, prioritized document that describes your operation's time losses in plain language — with a concrete proposal for each one.
Most consulting deliverables are written for the consultant's benefit — they demonstrate analytical rigor and justify the fee. The Time Map is written for your team's benefit. It's designed to be understood quickly, discussed in a meeting, and acted upon without needing to re-hire the consultant to explain it.
The visual format matters. When you can see where time flows and where it gets stuck — drawn out across a page — the problem becomes real in a way that a table of numbers never quite achieves. People recognize their own work in the diagram. That recognition is what drives action.
The prioritization matters equally. Not every inefficiency deserves the same attention. The Time Map ranks each identified issue by its estimated time impact, so your team knows where to start and can see quick results before tackling more complex changes.
Every element in the Time Map traces back to a specific observation made during the three days on-site. Nothing is assumed. Nothing is borrowed from another company's experience.
During the three days on-site, we maintain structured observation logs. Every interruption, every wait, every information handoff is recorded with a timestamp, a description, and the people involved. These logs are the raw material for everything that follows.
We group observations by type and frequency. A single interruption is noise. The same interruption happening eleven times across three days is a pattern — and a pattern is something that can be addressed systematically. We separate signal from noise before drawing any conclusions.
We construct a visual diagram of how information and tasks actually move through the organization — not how the org chart or the procedure manual says they should. This diagram shows the full path: who touches what, in what order, and where things stop moving.
For each identified inefficiency, we estimate the time cost per occurrence and the frequency per day or week. This gives us a basis for prioritization — not a precise accounting, but a clear ordering of where the most time is being lost.
For each prioritized inefficiency, we write one concrete proposal: what to change, how to change it, and what you'd need to make the change happen. The proposals are written to be implementable by your team without external help — no software purchases, no restructuring required.
The final document combines the visual flow diagram, the prioritized issue list, and the proposals into a single, readable document. It's presented to your leadership team in a structured session designed for discussion. After that session, the document is yours to use however you see fit.
A full diagram of how the key tasks and information flows in your operation actually work — with friction points, delays, and unnecessary steps marked visually.
A structured list of every identified inefficiency, ordered by estimated time impact. Each entry includes: what we observed, how often, and what it costs in time.
A highlighted subset of proposals that can be implemented in the first week with no budget and no new tools — immediate, visible changes to demonstrate momentum.
One page per prioritized issue: the observation, the estimated impact, the proposed change, and what's needed to make it happen. Written in plain language, not consulting jargon.
A suggested order for tackling the proposals — not a project plan, but a logical sequence that builds on early wins and avoids creating new dependencies.
A structured walkthrough of the document with your leadership team. We present, you question, and together you decide which proposals to prioritize. We don't make that decision for you.
The best way to understand the deliverable is to talk through your specific context. Get in touch and we'll walk you through how the three days would work in your company.
Start the Conversation